
We already posted our thoughts about the use of Google Ads in Malta and how businesses may be missing out on the benefits this powerful platform offers by not following three key principles.
In this case study, we take a close look – by sharing real numbers straight from our dashboard – at a Google Ads account that our team managed for a major retailer in Malta. We’ve had to omit names due to confidentiality reasons, but otherwise we decided to give an honest and transparent explanation of the results achieved.
We were in for a shock when we logged in to view our client’s Google Ads account. Sadly, it was a situation we encounter very often in our work.
Turning around an underperforming Ads account
The graph below compares Clicks and Average CPC over a period of approximately 2.5 years. You’ll note that for a very long time this account was either not yielding any result at all, or else underperforming greatly when the client launched campaigns.
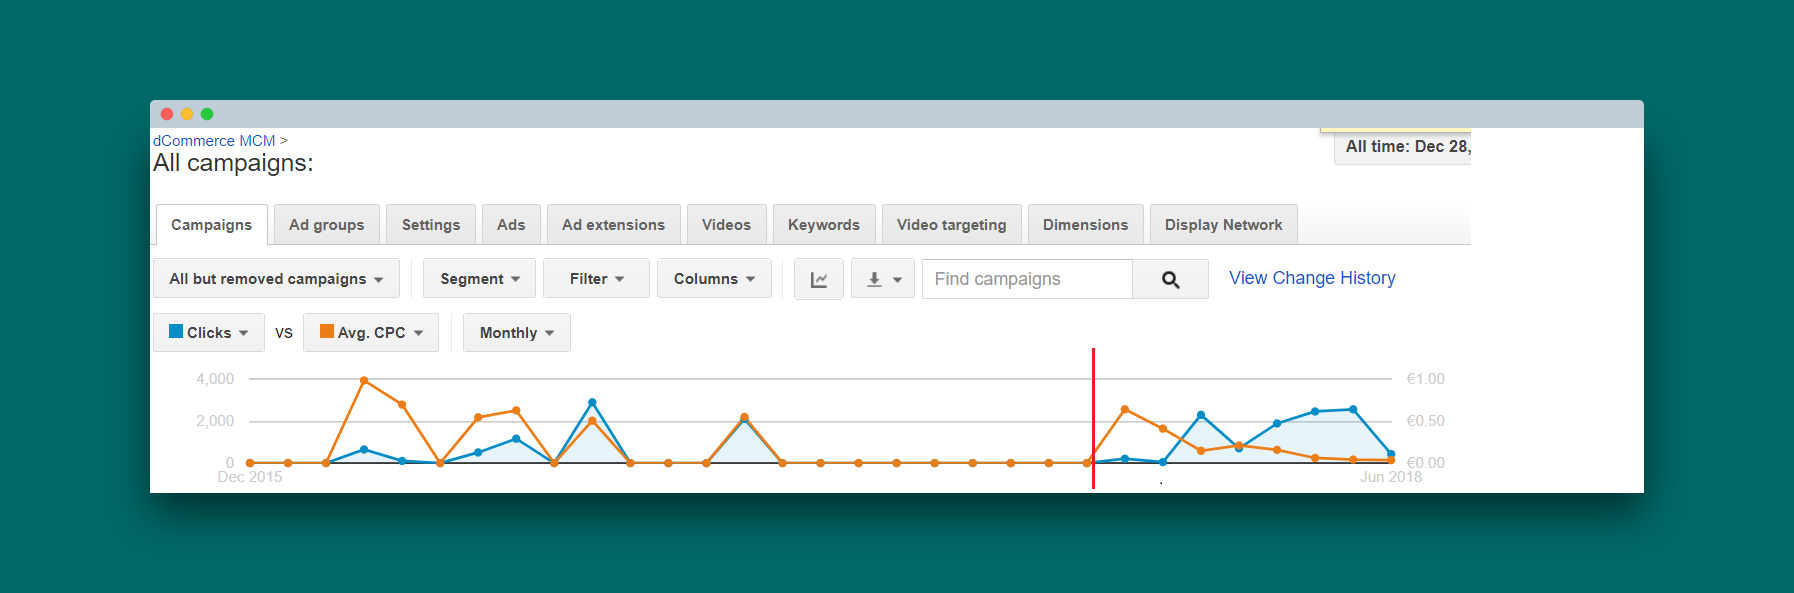
Observe how the orange line representing Average CPC peaks massively over the blue line showing Clicks on the left of the image, especially in the first and second bumps.
The third bumps shows a campaign that narrowly yielded more clicks for each dollar allocated in the budget, whereas the fourth bump shows a campaign that barely broke even.
The red line on the graph indicates when Systemato stepped into the picture. We don’t want to toot our own horns, so we’ll stick to the facts as explained by our PPC expert, Daniel, “This graph shows reducing CPC and steadily increasing clicks.”
This is evident in how the blue line crests over the orange line: a situation we were able to sustain for the majority of the team our team was managing the same Google Ads account.
Let’s take a look at another snapshot
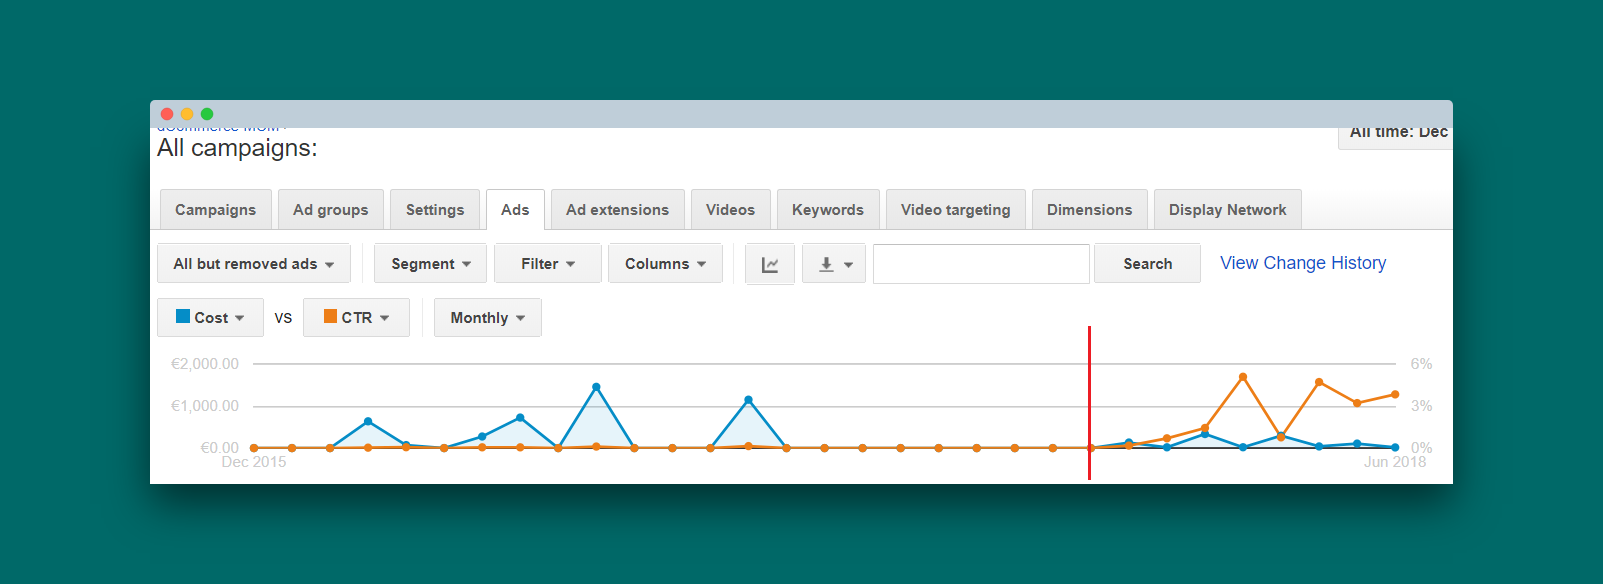
The graph above compares Cost and Click-through Rate (CTR), giving us a look at the number of people who clicked on the effectiveness of the adverts published on Google. This image tells a story very similar to the previous one; a series of unsuccessful efforts dominate the left side of the red line: blue peaks showing costs tower over the flat line of clicks.
On the right of the red line, after Systemato stepped in to manage the account, the situation changes drastically. In Daniel’s words, the graph “shows the reducing cost, but massively increasing CTR, thanks to improved targeting and nicely designed banners.”
During our team’s stint managing this account, we launched major Ads campaigns for Black Friday and the annual sales in January. As the rightmost part of both graphs indicates, the latter was a resounding success with over 160,000 impressions and 2,292 clicks earned with a total campaign budget of €334.
This translates to an average CPC of about 15 cents per click.
Campaign improvements from our work
In the months during which our team managed the client’s Google Ads, we registered the following improvements in the account’s performance:
- Cost per click dropped from 50 cents to only 4 cents per click
- Number of clicks increased from 1,150 to 2,550 per month
- Click-through rate surged from 0.1% to 3.8%
These are all average values, but in each case the difference between the first and second values is dramatic and proves how even an underperforming Google Ads campaign can be turned around into a feather in the company’s cap.